How to Detect Solar Panel Faults with a Thermal Camera? (2026 Guide)
How do you detect solar panel faults (hotspots, PID, cell cracks) with a thermal camera? Drone thermal inspection, the IEC 62446-3 standard, and the professional solar plant analysis process, in this guide.
Why Thermal Inspection Matters for Solar Power Plants
Most faults at a solar power plant are invisible to the naked eye. A single cracked cell or a failed bypass diode in a panel string can go unnoticed for months while quietly eating into production. Thermal camera inspection of solar panels is the most reliable way to surface these invisible losses.
In this guide, we walk through how solar panel faults are detected with a thermal camera, which fault types can be imaged, why drone-based thermal inspection outperforms manual checks, and what the IEC 62446-3 standard requires from a professional thermal analysis process.
Financially speaking, an undetected hotspot doesn't just affect the panel it's on -- over time it can drag down the yield of the entire string. Even a simple calculation based on annual production estimates shows that a few weeks of delayed intervention can cost far more in lost revenue than the thermal inspection itself.
This guide is written for solar plant operators, O&M teams, EPC contractors, and investors evaluating thermal inspection services. Without assuming a technical background, it covers the full process end to end -- from the fault types you'll encounter in the field to professional reporting.
What Is a Thermal Camera Inspection of Solar Panels?
A thermal camera inspection of solar panels measures the infrared radiation emitted from the panel surface and converts it into a temperature-distribution image. A healthy panel shows a temperature profile similar to its neighbors; when a fault is present, that area shows a distinct temperature deviation (ΔT).
Unlike electrical testing, this method requires no physical intervention on site and can be carried out while the plant is generating, during daylight hours. That makes thermal inspection both fast and non-disruptive to operations.
Measurement accuracy is sensitive to the camera's emissivity setting, ambient temperature, and reflected solar radiation, which is why a professional inspection focuses less on raw temperature readings and more on the relative temperature difference (ΔT) against a healthy reference panel. This approach largely cancels out variation caused by ambient conditions and keeps results comparable across different collection times or days.
Thermal sensors used in the field typically range from 320x240 to 640x512 pixels in resolution; drone altitude and sensor resolution together determine how many pixels a panel occupies in the image, and therefore how well small faults can be distinguished.
Why Is Thermal Inspection Performed?
Thermal inspection isn't just about finding faults -- it protects a solar power plant's long-term performance. Plants with a regular thermal inspection program catch faults while they're still small, keeping intervention costs low and production loss short-lived.
Without inspection, a small hotspot can spread to neighboring cells over time, a bypass diode can fail completely, or an entire string can be affected. Every one of these scenarios ends up costing far more than the price of the original detection would have.
Manufacturer warranties typically cover panels only below a certain performance-loss threshold; proving that threshold has been crossed requires a dated, GPS-tagged thermal report backed by ΔT values. The same document strengthens the site team's hand considerably in insurance claim discussions.
Industry observations show that plants with a regular thermal inspection program experience less annual production loss than comparable plants with no inspection at all -- a gap that translates into a meaningful revenue difference at scale, especially across large portfolios.
- Catching faults early, at a low cost, before they grow
- Providing objective evidence for warranty and insurance processes
- Helping maintenance crews reach the right panel quickly on site
- Comparing the plant's annual production estimate against real performance
Common Faults Detectable with a Thermal Camera
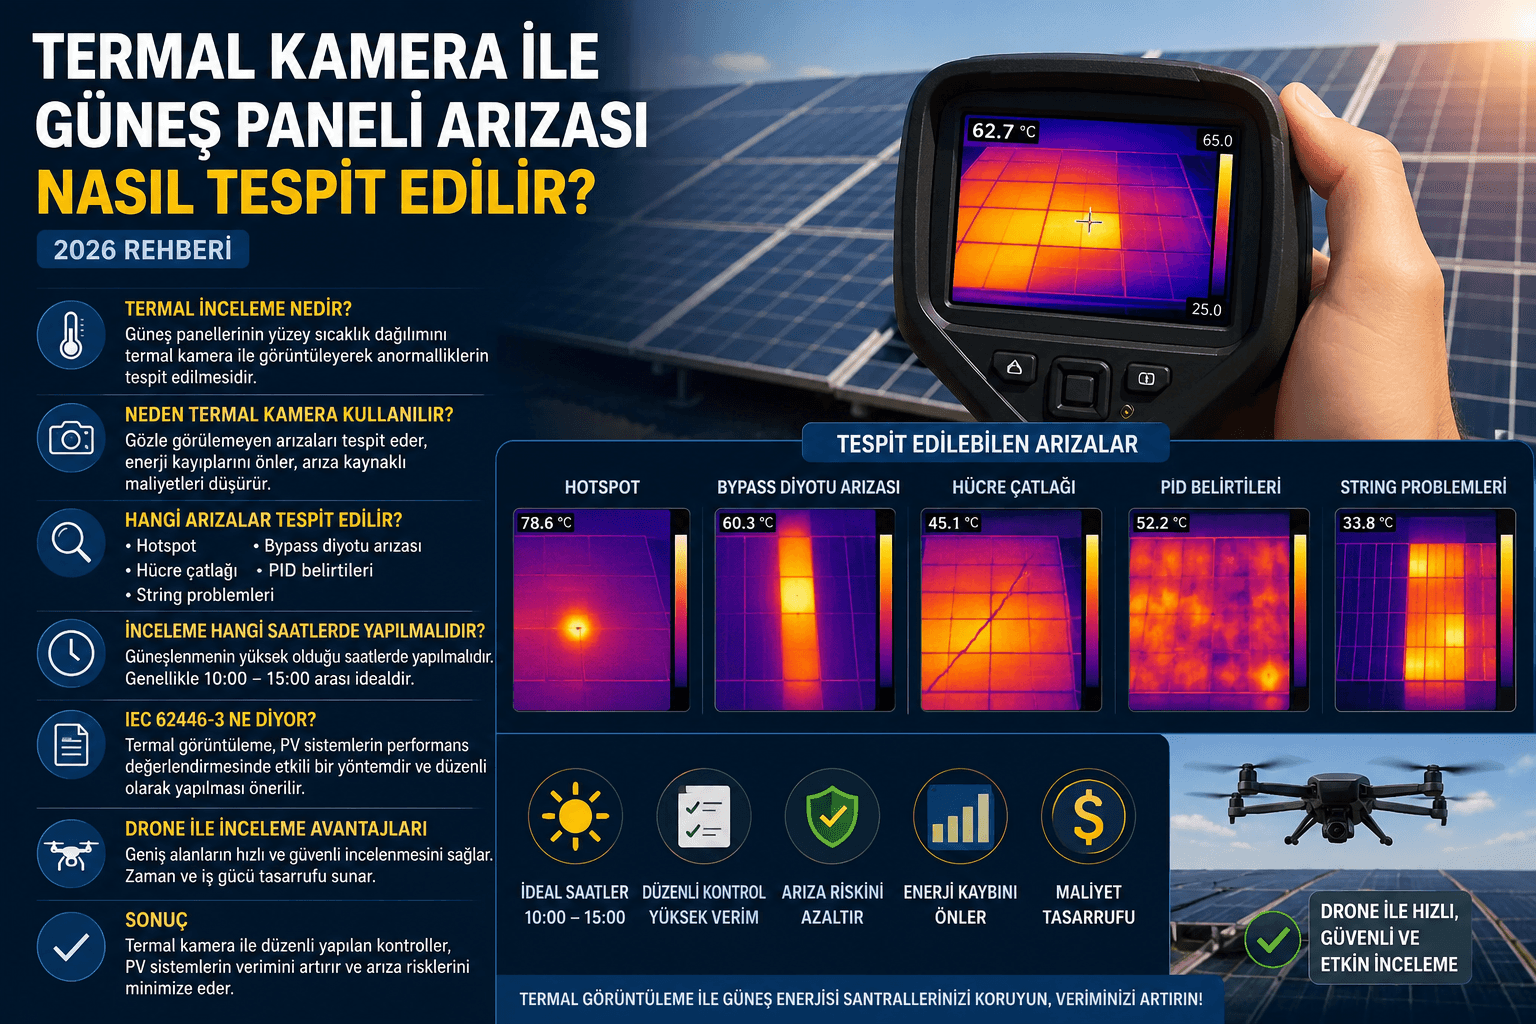
Every fault type leaves its own distinct temperature signature in thermal camera imagery. Below are the seven fault types most commonly encountered in the field, and how each one appears on a thermal camera.
| Fault Type | Typical ΔT Range | Urgency Level |
|---|---|---|
| Hotspot | 15°C - 30°C+ | Critical |
| Bypass Diode Failure | 10°C - 20°C | High |
| Cell Cracks | 5°C - 15°C | Medium |
| PID Symptoms | 5°C - 12°C | Medium |
| String Issues | 3°C - 10°C | Medium |
| Connector Overheating | 20°C - 40°C+ | Critical |
| Junction Box Issues | 10°C - 25°C | High |
Hotspot
A hotspot is a point where a cell or group of cells heats up abnormally compared to its neighbors. It's usually caused by shading, soiling, a microcrack, or a degraded solder joint. On a thermal camera it appears as a narrow, intense bright spot, often with a ΔT above 20°C.
A hotspot left undetected in its early stages can cause permanent cell damage and, in some cases, a fire risk; that's why hotspots classified as Critical typically get a field response scheduled within a few days.
Bypass Diode Failure
A bypass diode protects the rest of the string by disabling a shaded or faulty group of cells. When the diode itself fails, the entire associated cell group heats up continuously; on a thermal camera this shows up as a rectangular band of uniform, elevated temperature.
This fault typically affects the performance of the entire cell group the diode serves, not just a single panel; left undetected, the diode's overheating can also damage neighboring components.
Cell Cracks
Cell cracks caused by transport, installation, or mechanical stress disrupt the even distribution of current across the cell surface. On a thermal image this shows up as a thin, linear temperature pattern that can widen over time and affect neighboring cells.
Depending on the size and location of the crack, its impact can range from a mild yield loss to the cell being knocked out entirely -- which is why repeated inspections at regular intervals matter for tracking how a crack progresses over time.
PID Symptoms
PID (Potential-Induced Degradation) results from the potential difference between high system voltage and ground driving ion migration at the cell surface. Affected panels show an irregularly bounded warming pattern covering a specific region of the panel on a thermal camera, typically clustering at a particular position within a string.
Panels showing PID symptoms tend to cluster at one end of a string, since those panels are exposed to the highest potential difference relative to system grounding; this clustering pattern is an important clue for distinguishing PID from other fault types in thermal analysis.
String Issues
A connection fault or connector failure somewhere in a string can cause every panel on that string to show a temperature profile different from what's expected. These faults don't show up on a single panel -- they appear as a consistent temperature difference running the length of the string.
Such faults usually originate from a loose terminal in a junction box or a damaged cable connection; a consistent temperature difference across the string is a sign that the root cause lies in the string's electrical integrity, not in one individual panel.
Connector Overheating
A loose connection or oxidation in an MC4 connector increases contact resistance and causes localized heating. This fault doesn't appear on the panel itself but as a point-source temperature increase at the cable/connector area along the panel's edge, and it carries a fire risk that warrants priority response.
This fault type can progress over time to connector melting and a DC arc fault, which is why it's treated among the highest-priority findings in a thermal inspection.
Junction Box Issues
A loose connection, moisture ingress, or diode failure inside a junction box causes the entire box to run noticeably hotter than its surroundings. This fault is typically caught by scanning the back of the panel and, if not addressed early, can progress to connector damage.
These faults usually go unnoticed on visual inspection, since the outside of the box can look largely intact; a thermal camera is the only method that reveals the internal electrical issue from the outside, without contact.
Prioritizing Findings
The ΔT ranges in the table above can vary by site conditions, but the overall prioritization logic holds: Critical findings (hotspots, connector overheating) should be addressed within a few days, High findings at the next scheduled maintenance visit, and Medium findings under routine monitoring.
The Advantages of Drone-Based Thermal Inspection
Site inspections traditionally carried out with a handheld thermal camera are both time-consuming and limited in coverage on large solar power plants. Drone-based thermal inspection removes most of these limitations.
In Türkiye, drone operations are subject to Civil Aviation Authority (SHGM) regulations; a professional thermal inspection provider handles the required permits and site safety protocols in full before every flight.
- Scanning hundreds of acres in hours, at a consistent flight altitude and angle
- Automatically logging every panel's GPS location to match a fault to the right panel
- Removing the risk of field crews working at height or in hard-to-reach areas
- Collecting RGB and thermal imagery on the same flight to assess visual and thermal anomalies together
- Standardizing the inspection process so results from different dates are directly comparable
The Difference Scale Makes
Taken together, these advantages make drone-based thermal inspection not just a technology preference but an operational necessity for managing a growing solar plant portfolio.
The Best Weather Conditions for Thermal Inspection
Reliable thermal inspection results depend on the right weather and irradiance conditions. Imagery collected under the wrong conditions can produce false temperature differences or cause real faults to be missed.
| Parameter | Recommended Value | Why It Matters |
|---|---|---|
| Time of Day | Between 10:00 and 15:00 | Panels need sufficient solar irradiance to operate in a stable power-generation regime |
| Irradiance | At least 600-700 W/m² | At low irradiance, temperature differences between panels don't become distinct enough |
| Wind | Under 5 m/s | High wind rapidly cools the panel surface, making ΔT values read lower than they actually are |
| Cloud Cover | Clear or lightly overcast sky | Variable cloud cover causes irradiance to fluctuate during the flight, producing inconsistent data |
What Happens to Data Collected Outside Ideal Conditions?
Data collected outside these conditions isn't necessarily unusable, but it requires the analysis team to interpret raw ΔT values with extra care. A professional thermal analysis provider plans flights around these parameters from the outset to ensure reliable data collection.
What Does the IEC 62446-3 Standard Say?
IEC 62446-3 defines internationally recognized technical specifications for drone-based thermal imaging inspections of photovoltaic systems. The standard sets concrete requirements covering flight conditions, camera resolution, minimum irradiance thresholds, and anomaly classification criteria.
A report prepared to this standard documents the severity of every detected anomaly using a consistent classification, making inspections from different dates -- or reports from different providers -- comparable. That, in turn, strengthens the credibility of the report for both investors and EPC/O&M firms.
The standard requires that camera resolution provide sufficient pixel density per panel, that flights be conducted from a defined angle and altitude relative to the panel surface, and that data collected below a minimum solar irradiance threshold (typically around 500-700 W/m²) be excluded from analysis. These technical requirements line up directly with the weather-condition guidance covered earlier, and applying both together substantially improves inspection quality.
The standard also recommends that the analysis be carried out by a competent person and that the report be independently verifiable. This requirement reflects that thermal analysis is not just image processing, but a discipline that calls for engineering judgment.
The Professional Thermal Analysis Process
A professional thermal analysis is never a single image -- it's a process made up of five sequential stages.
RGB Imagery
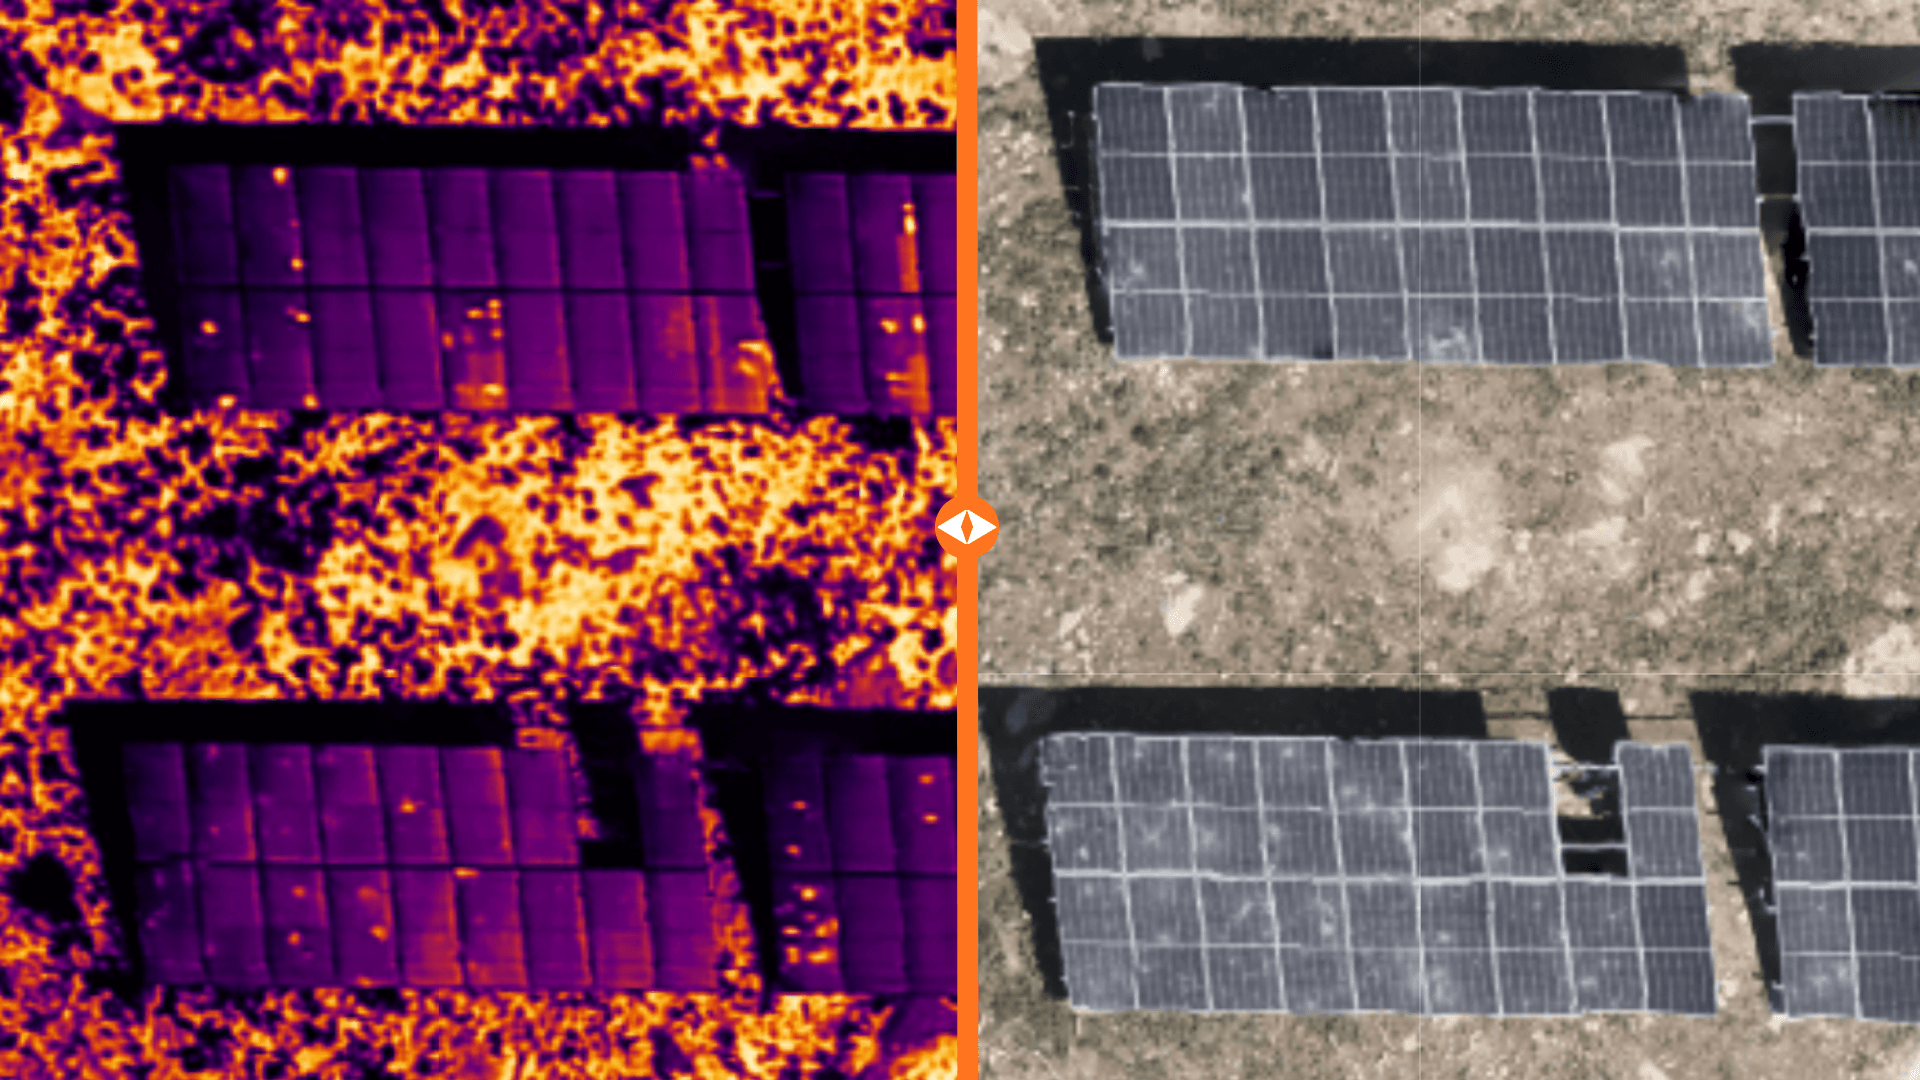
Alongside the thermal scan, the drone also collects high-resolution RGB imagery. These images are stitched together into a full RGB orthophoto of the site, enabling detection of visual faults like broken glass, soiling, and vegetation shading.
This imagery doesn't just reveal visual faults -- it also provides physical context for thermal anomalies; for example, the RGB image clarifies whether a hotspot sits beneath a cracked pane of glass or a bird's nest.
Thermal Imagery
Thermal frames collected on the same flight are stitched together into a thermal orthophoto. This image shows the temperature distribution across the entire site on a single map and clarifies where anomalies fall relative to the whole plant.
The orthophoto-generation process aligns hundreds, sometimes thousands, of thermal frames into a single seamless image -- making it easier to see the distribution pattern of faults across the site and spot a possible common root cause, such as a specific production batch or installation row.
ΔT Analysis
The temperature difference (ΔT) between a healthy reference panel and a suspect area is calculated. ΔT is the most objective way to tell whether an anomaly is a real fault or just measurement noise.
This step is usually semi-automated in software: the analyst selects two reference points, and the system scans every other potential anomaly against that reference to calculate the temperature difference.
Anomaly Classification
Based on the calculated ΔT value, every anomaly is assigned a Low, Medium, High, or Critical severity level. This classification lets the field team direct its limited resources to the faults that need the most urgent attention.
This four-level classification aligns with the approach recommended by IEC 62446-3 and makes it possible to compare results from inspections carried out on different dates, or by different providers, on the same scale.
Reporting
All findings -- panel location, ΔT value, severity level, and the paired RGB/thermal images -- are compiled into an IEC 62446-3 compliant report. This report serves as the reference document across many processes, from maintenance planning to warranty claims.
A well-prepared report isn't just a list of findings; it's a decision-support document offering different levels of detail for site management, maintenance crews, and investors.
Why Use a Drone Instead of Manual Inspection?
Manual inspection with a handheld thermal camera can still be an option for small sites, but it carries serious limitations at medium and large solar power plants.
This gap widens considerably for operators managing multiple sites: manually inspecting dozens of plants can take weeks, while the same work can be completed in days with a drone fleet and a standardized flight protocol.
As the table below shows, drone-based thermal inspection doesn't just offer a speed advantage -- it also improves data consistency and report reliability. That's why drone-based inspection has become an operational necessity, not just an option, across growing solar plant portfolios.
| Criterion | Manual Inspection | Drone-Based Thermal Inspection |
|---|---|---|
| Duration (1 MWp site) | 1-2 days | 1-3 hours |
| Coverage Consistency | Variable, depends on crew fatigue | Complete and repeatable via a fixed flight path |
| Location Accuracy | Manual note-taking, high error margin | GPS-tagged, panel-level precision |
| Field Crew Risk | Walking risk among high-voltage lines | Safe operation from outside the array |
| Reporting Standardization | Inconsistent, depends on the individual | IEC 62446-3 compliant, repeatable |
The Practical Bottom Line in the Field
Particularly on sites above 5 MWp, the labor and time a manual inspection requires pays back the total cost of a drone-based inspection quickly, making drone use a rational choice economically as well as technically. This math gives site managers a concrete reference point when prioritizing the thermal-inspection line item in an annual O&M budget.
Conclusion
Detecting solar panel faults with a thermal camera is a critical maintenance practice that directly affects a solar power plant's long-term financial performance. From hotspots to PID, from bypass diode failures to junction box issues, many fault types can only be reliably detected through thermal imaging.
A drone-based, IEC 62446-3 compliant thermal analysis process improves both inspection speed and report reliability, helping field teams focus on the right priorities. A solar power plant without a regular thermal inspection program risks serious production loss over the years due to small faults that go unnoticed.
In short, when the right equipment, the right weather conditions, and an IEC 62446-3 compliant methodology come together, thermal-camera-based fault detection in solar panels becomes one of the highest-return maintenance practices for protecting a solar plant investment.
Summary
- A thermal camera detects invisible panel faults through the temperature deviation (ΔT) they cause.
- Hotspots, bypass diode failures, cell cracks, PID, string issues, connector overheating, and junction box issues are the seven most common fault types.
- The most reliable results come from flights between 10:00 and 15:00, under clear skies and low wind.
- IEC 62446-3 ensures consistency in reporting and classification for drone-based thermal inspections.
- The professional analysis process consists of RGB imagery, thermal imagery, ΔT analysis, anomaly classification, and reporting.
- Drone-based inspection is a far faster, more consistent, and safer alternative to the manual method.
- Critical findings should be addressed within a few days; High findings at the next scheduled maintenance visit.
Frequently Asked Questions
When performed under the right weather conditions with calibrated equipment, thermal imaging detects temperature-based issues like hotspots and bypass diode failures with high accuracy. Result reliability depends on irradiance level, flight altitude, and the accuracy of the analysis method.
For most solar power plants, one thermal inspection per year, preferably during a high-irradiance period, is sufficient. An additional inspection is recommended after severe weather events or an unexpected drop in production.
As a general rule, deviations above 5°C are considered an anomaly worth monitoring, while deviations above 15°C are treated as a serious fault requiring priority action. Exact thresholds can vary by panel type and site conditions.
Drone-based thermal inspection works at every scale, from a few-hundred-kWp rooftop system to a large-scale solar plant of several hundred MWp. The time and cost advantage of using a drone only grows as the site gets larger.
A thermal camera shows the location and severity of a fault; identifying the precise root cause usually requires pairing it with an electrical test on site, such as an I-V curve measurement. That's why thermal inspection is the first and fastest step in field diagnostics.
While not a legal requirement, IEC 62446-3 compliant reports are increasingly requested in insurance, warranty, and investor reporting processes. Reporting to this standard proves the technical credibility of the inspection.
SunLove X automatically runs orthophoto generation, ΔT analysis, and anomaly classification on the RGB and thermal imagery you upload; small and medium-sized sites are typically analyzed within a few hours and delivered as an IEC 62446-3 compliant report.
A complete thermal inspection report should include each anomaly's GPS location, ΔT value, severity level, paired RGB and thermal images, and the inspection date. IEC 62446-3 compliant reports present this information in a standard format.
No. Because the drone collects imagery from the air, thermal inspection doesn't require shutting down the plant's production; the inspection is carried out while the plant is generating at full capacity.
Yes. Archiving past thermal imagery makes it possible to compare a panel's or area's temperature behavior over time and catch slow-progressing faults, such as gradual PID effects, early.
The replacement decision isn't based on the thermal finding alone -- it also depends on the panel's age, warranty status, and electrical test results. A Critical-level hotspot often calls for replacement or repair, while Low-level findings are typically placed under monitoring.