See Every Panel. Perfectly.
Manage your RGB and thermal imagery on a single platform. Generate orthophotos, run ΔT analyses, and prepare your professional reports in minutes.
One Platform. Complete Control.
Upload drone imagery, analyze thermal data, review anomalies, and generate professional reports — all from one platform.
IEC-Compliant Thermal Analysis
Professional thermal inspection to the IEC 62446-3 standard.
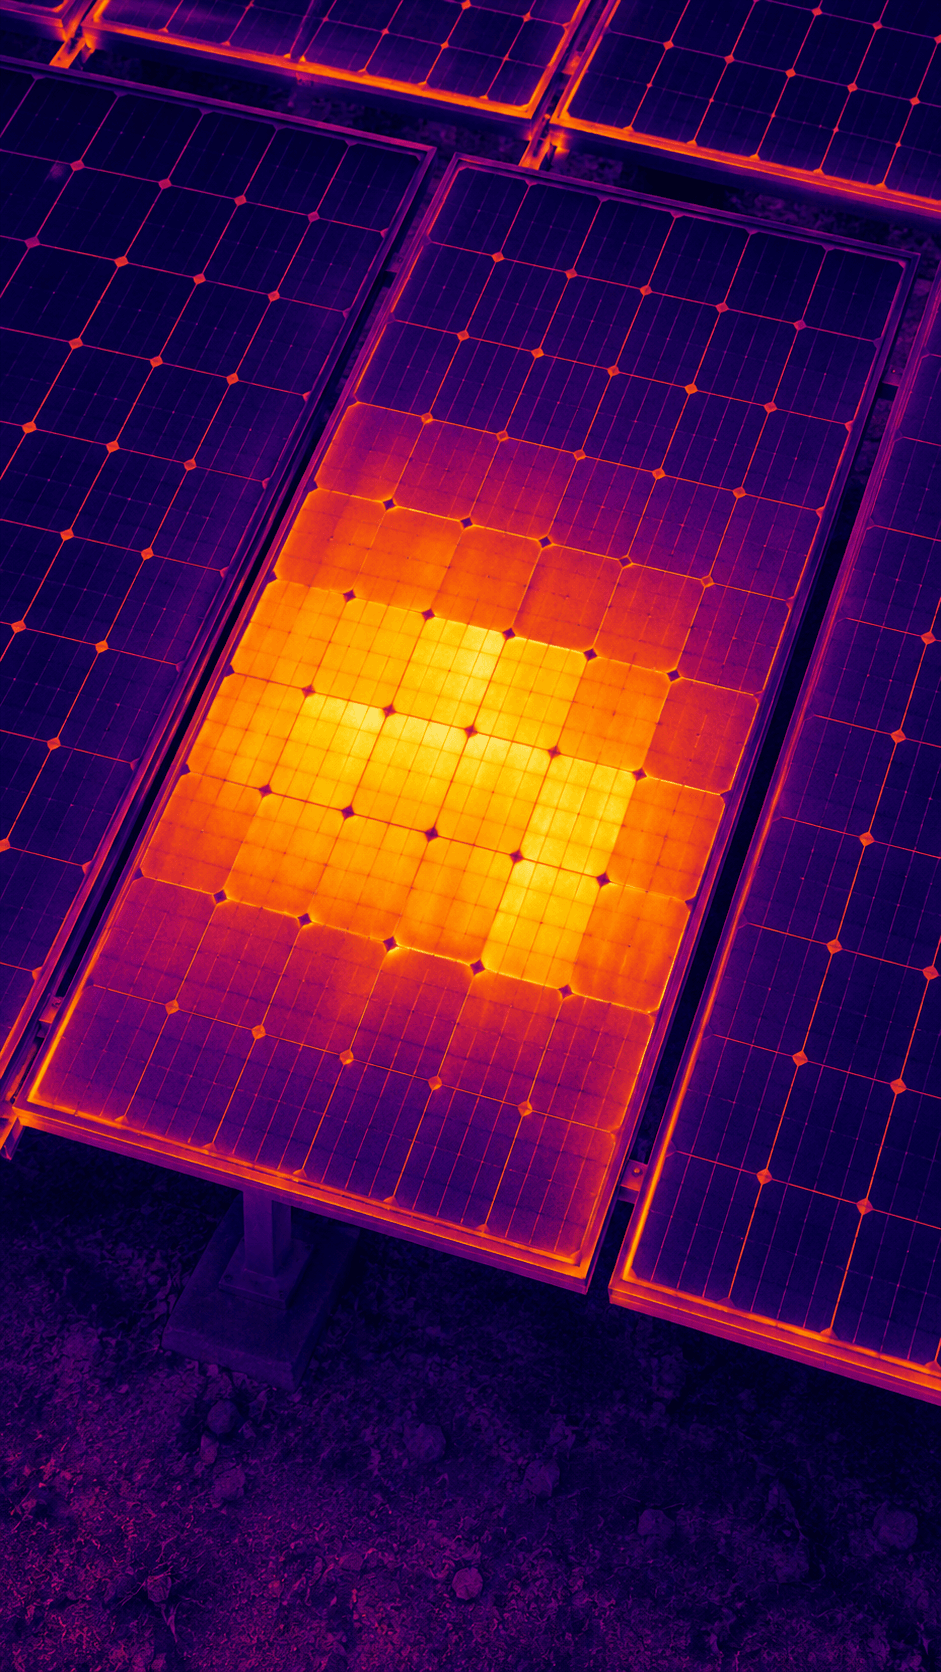
ΔT-Based Anomaly Detection
Automatically detect and prioritize temperature deviations.
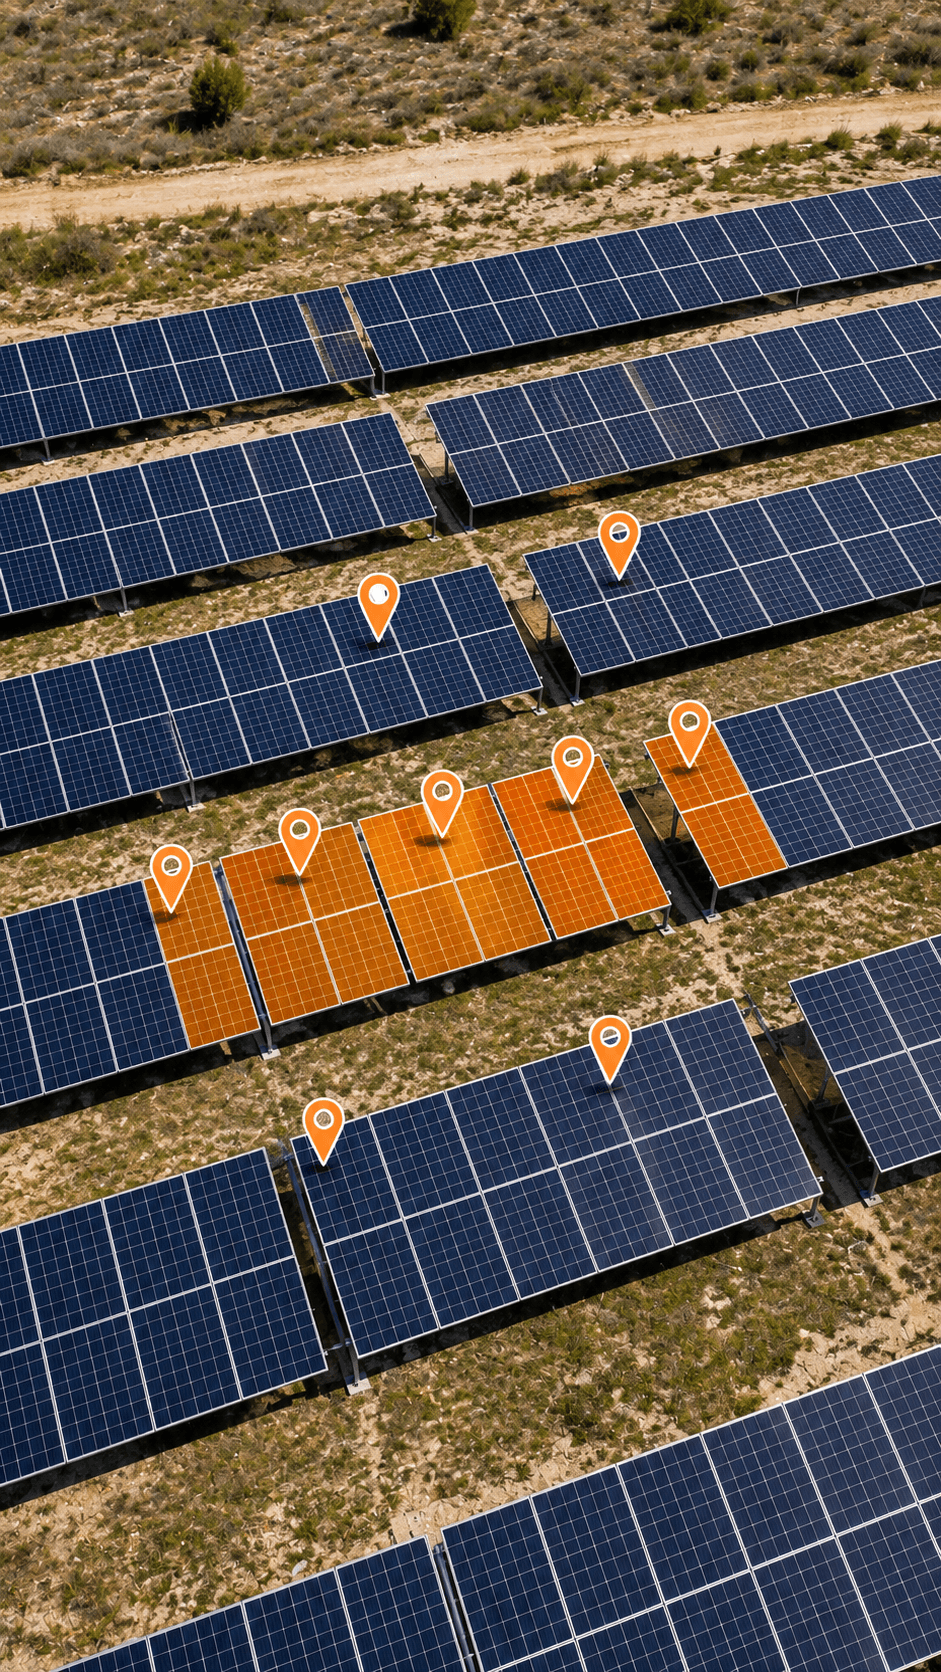
Map & Coordinate Management
Find every panel instantly on the map by its GPS location.
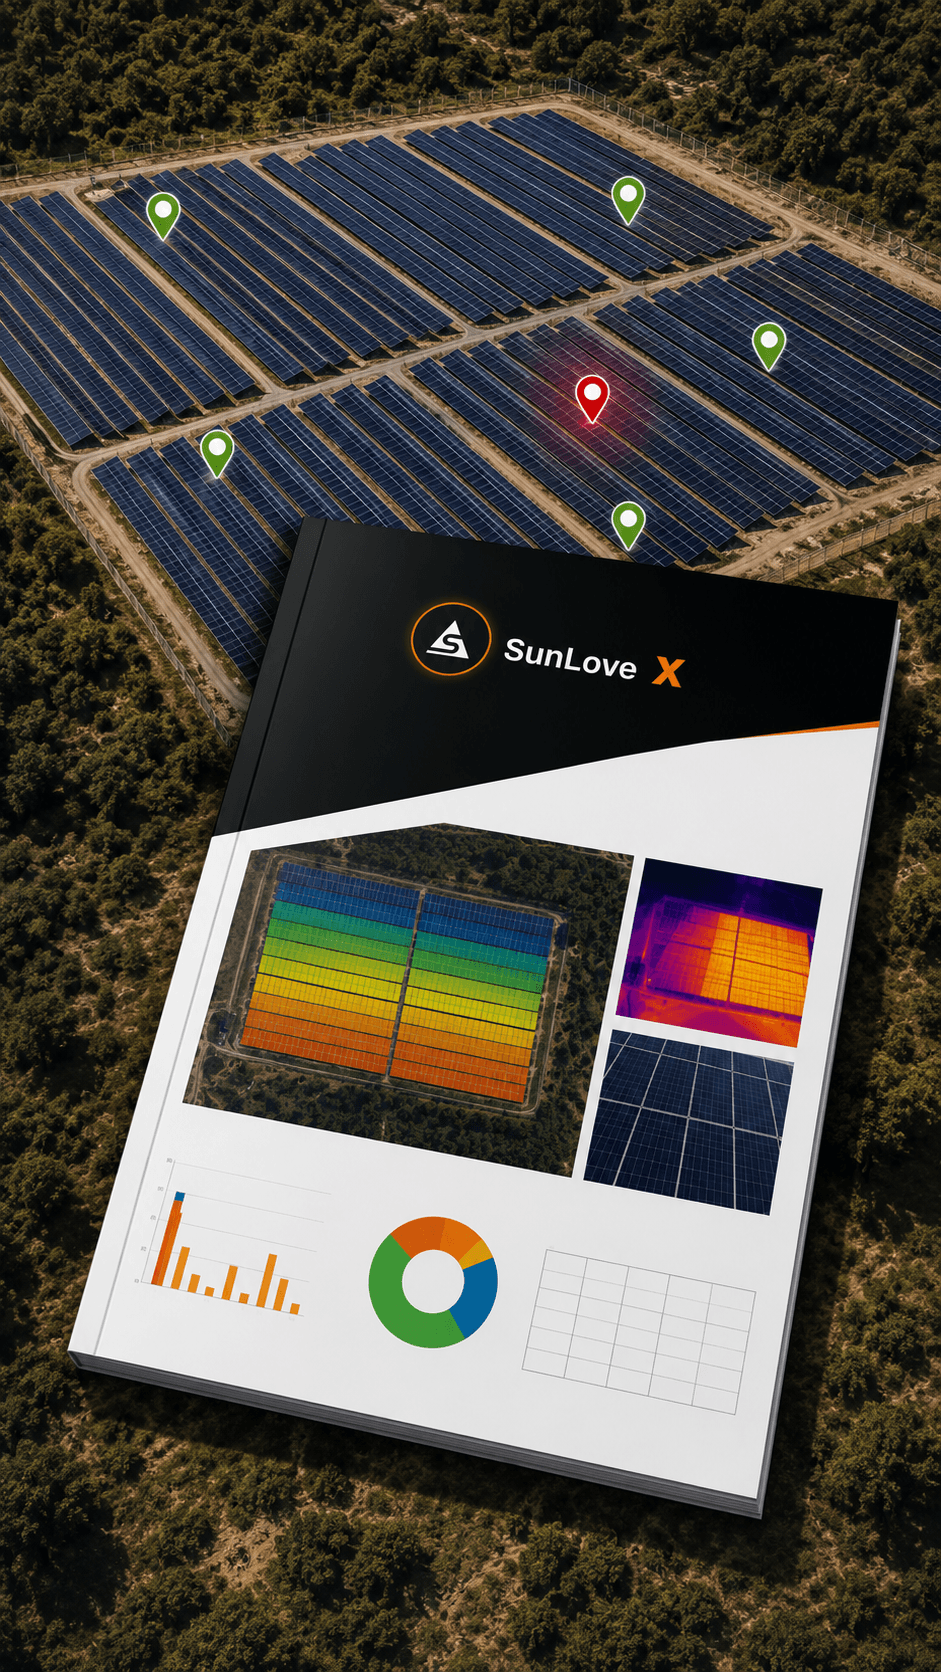
Professional Reporting
Generate branded, automatic PDF reports in Turkish and English.
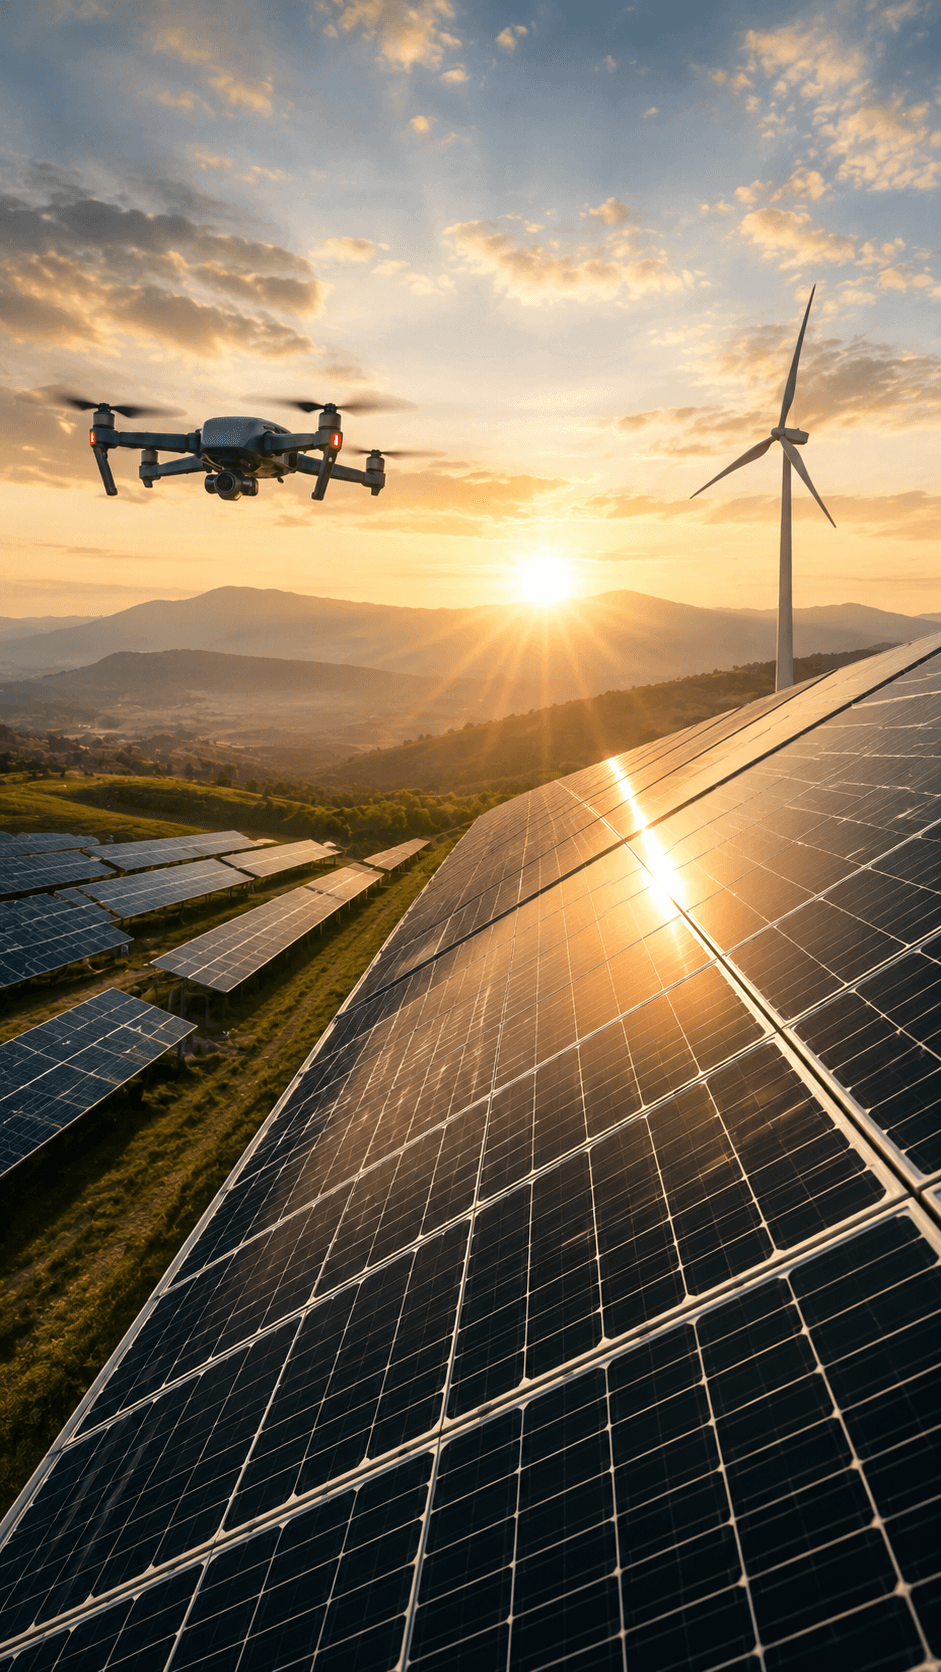
Reduce Production Losses
Catch failures early and prevent energy production loss.
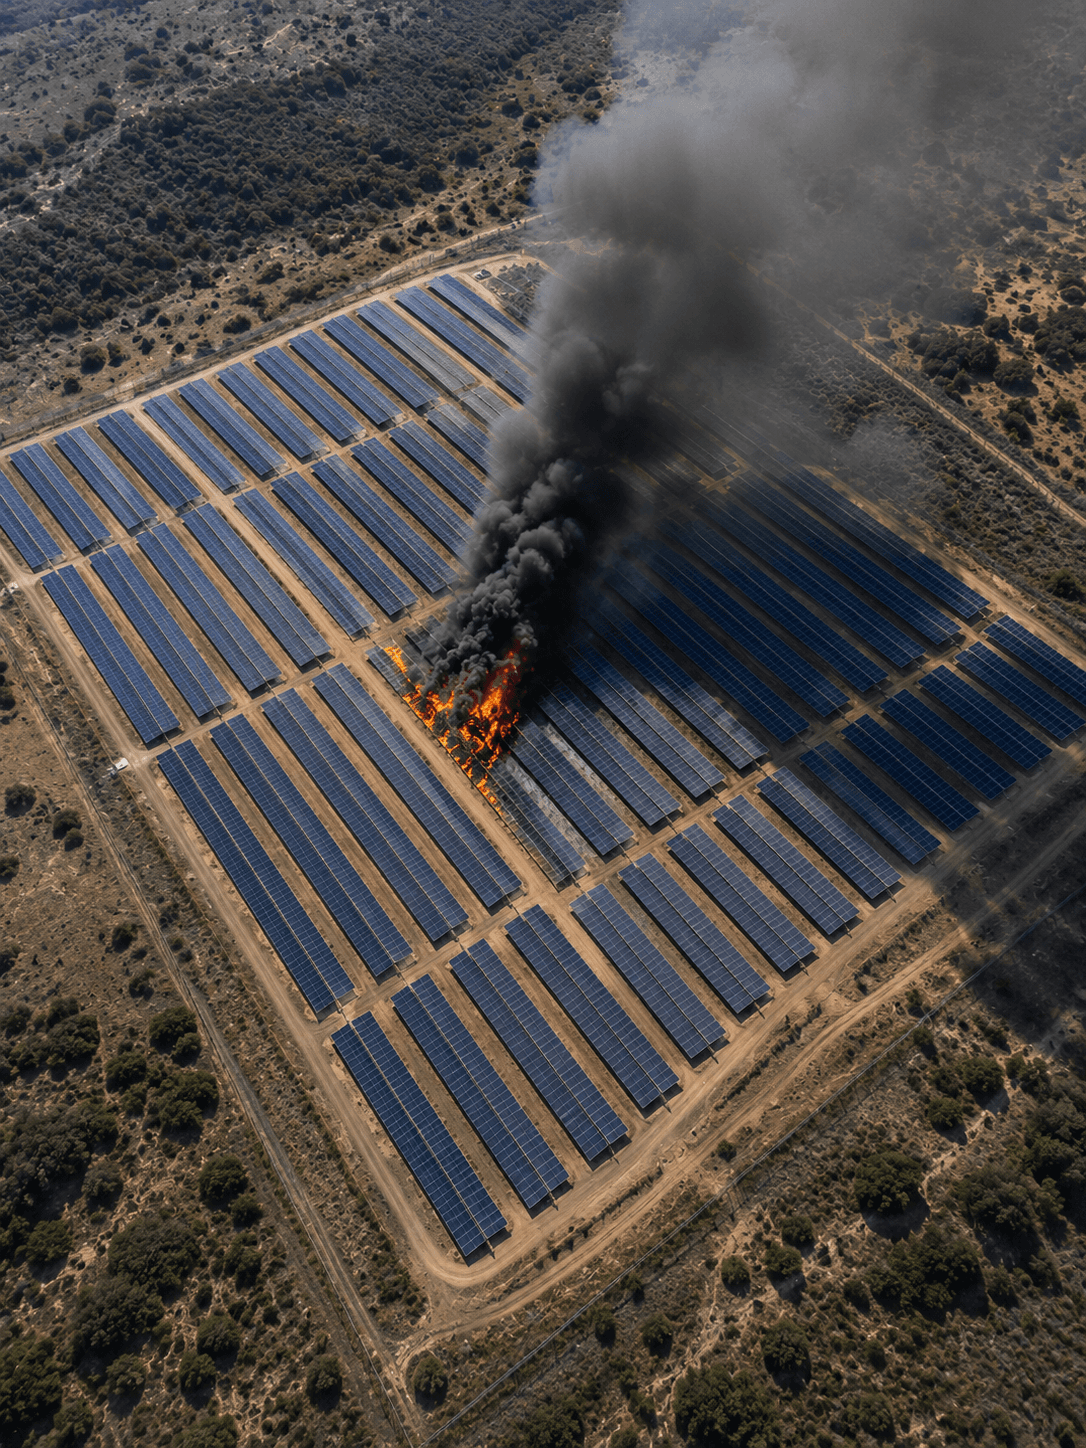
Get Fire Risks Under Control
Spot critical temperature spikes before they become fire risks.
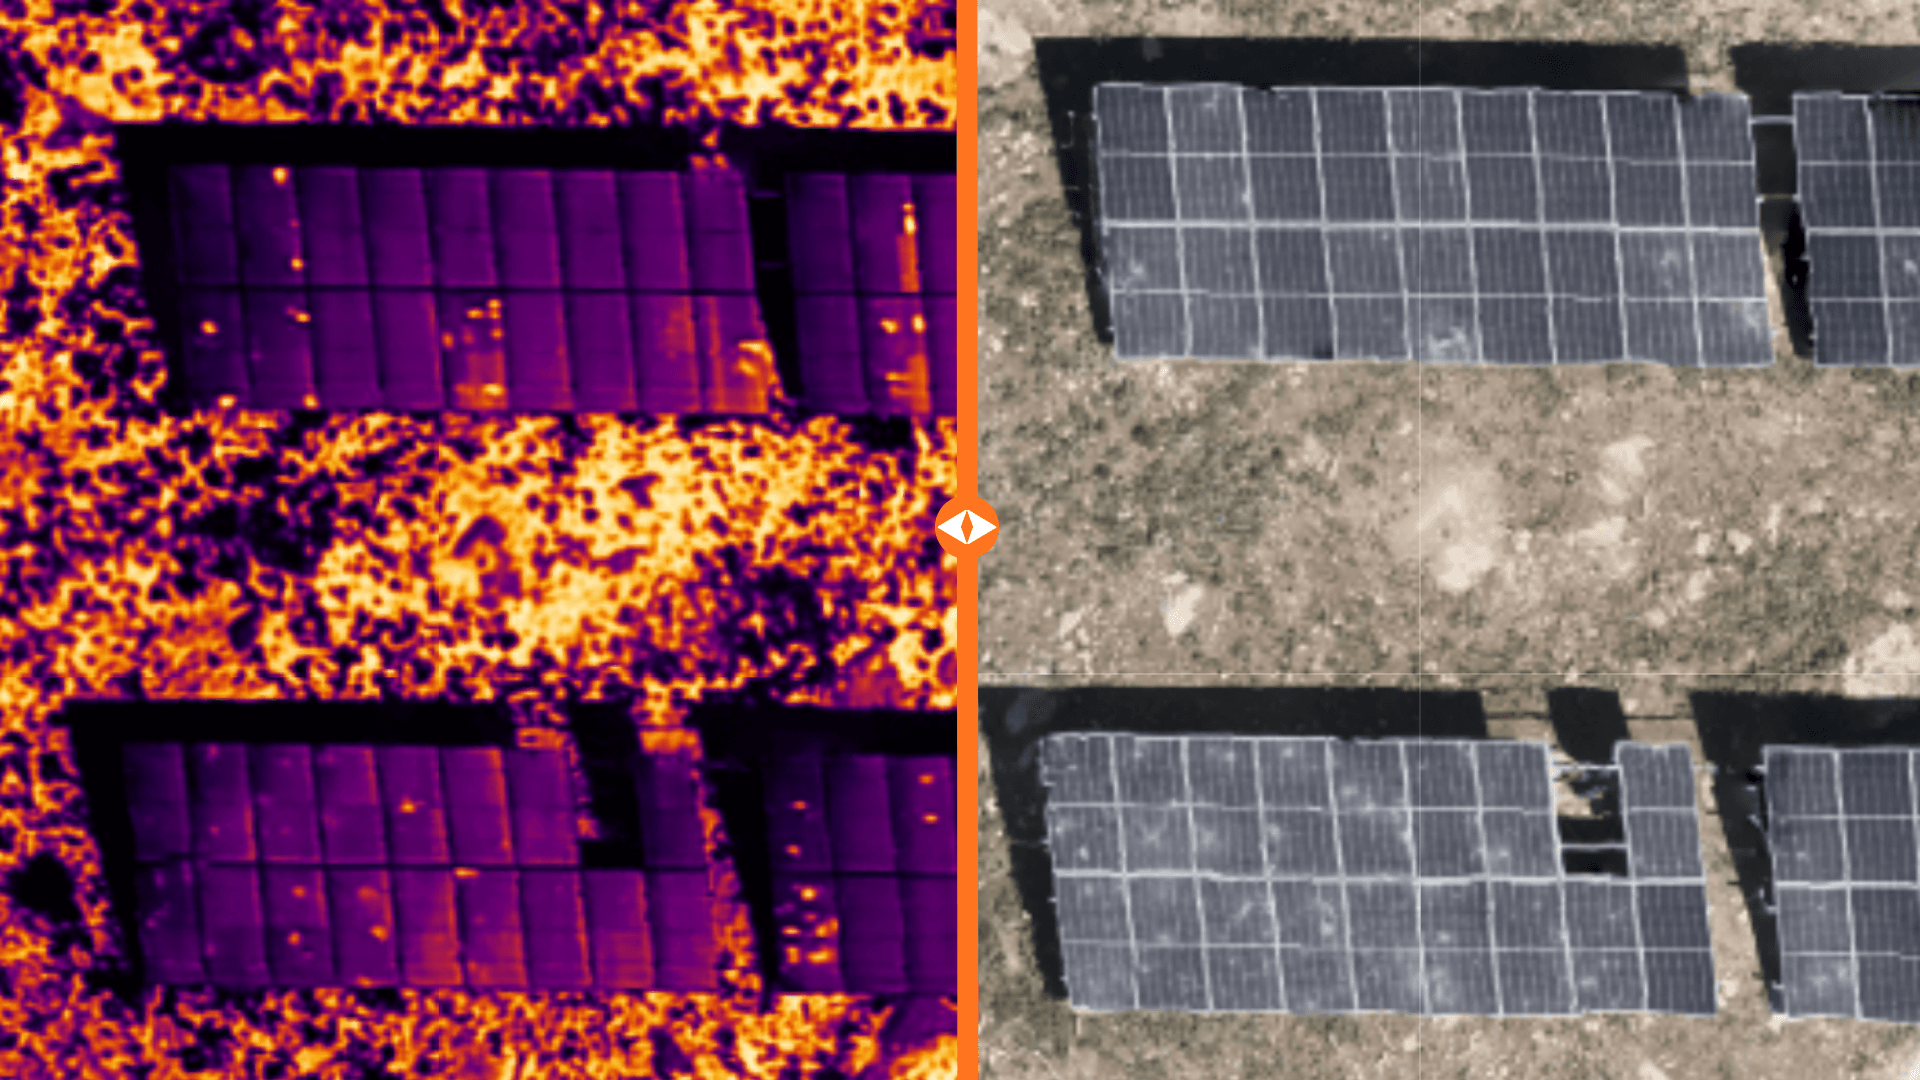
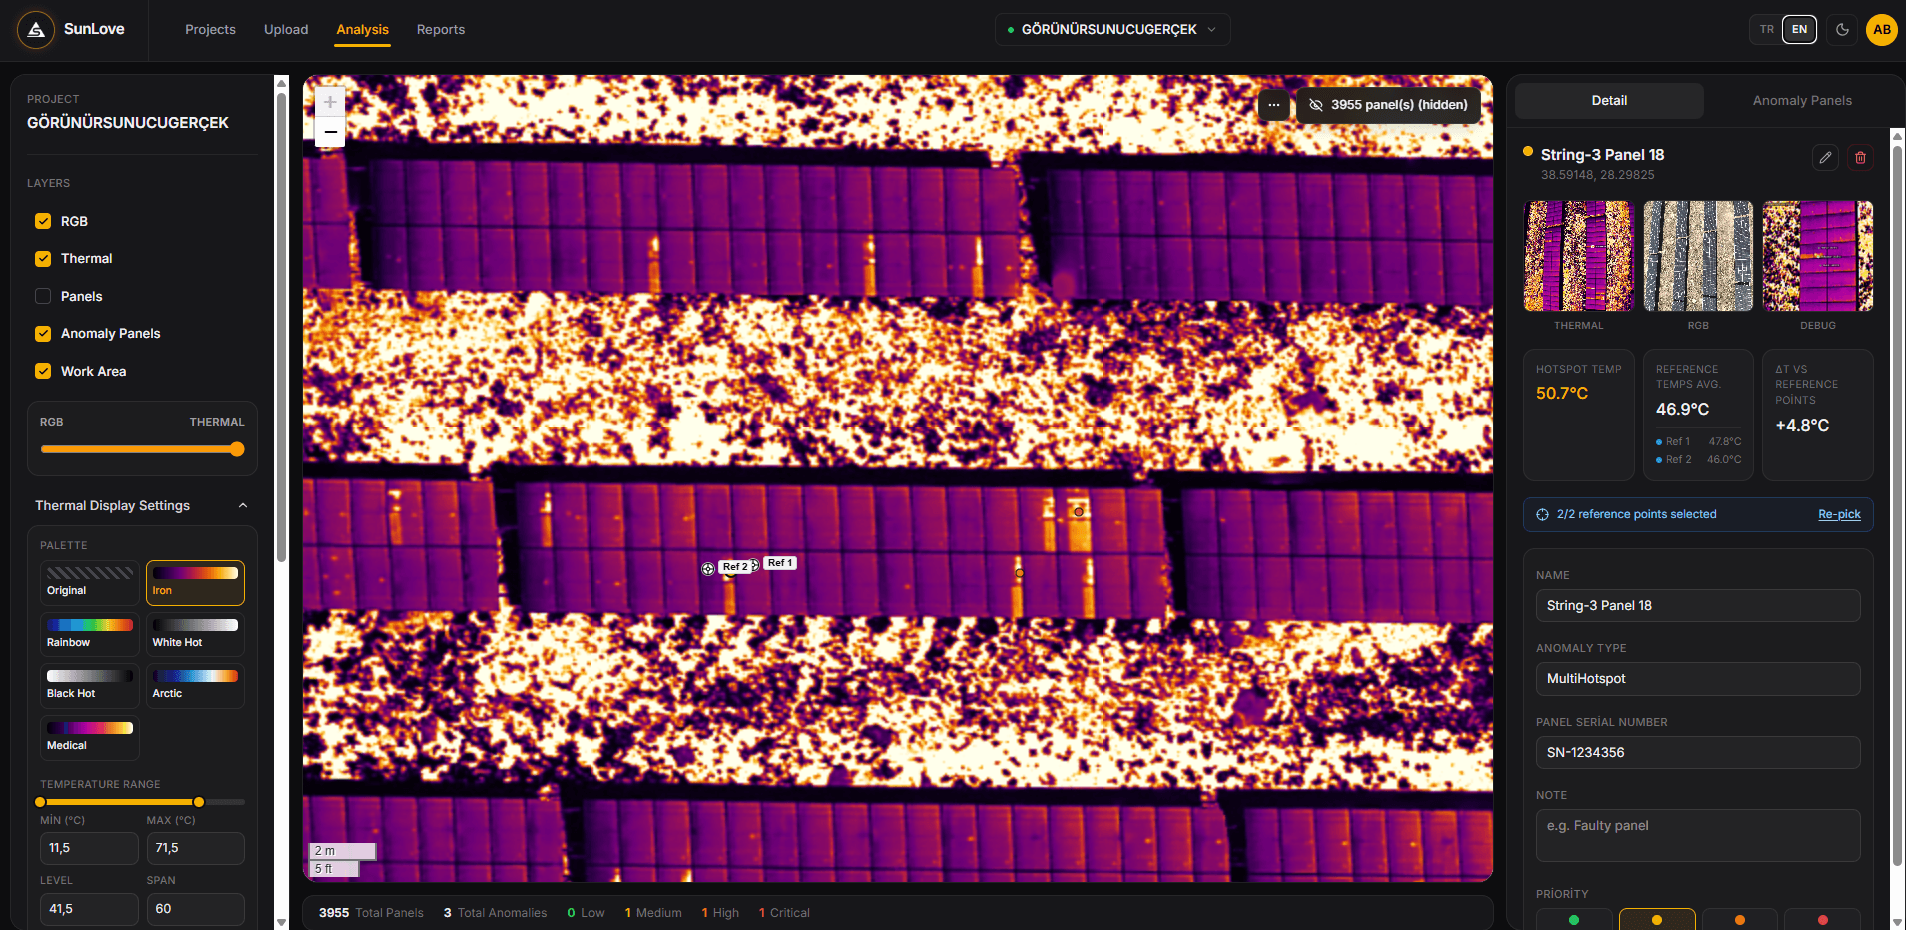
Compare RGB and Thermal Imagery in One View
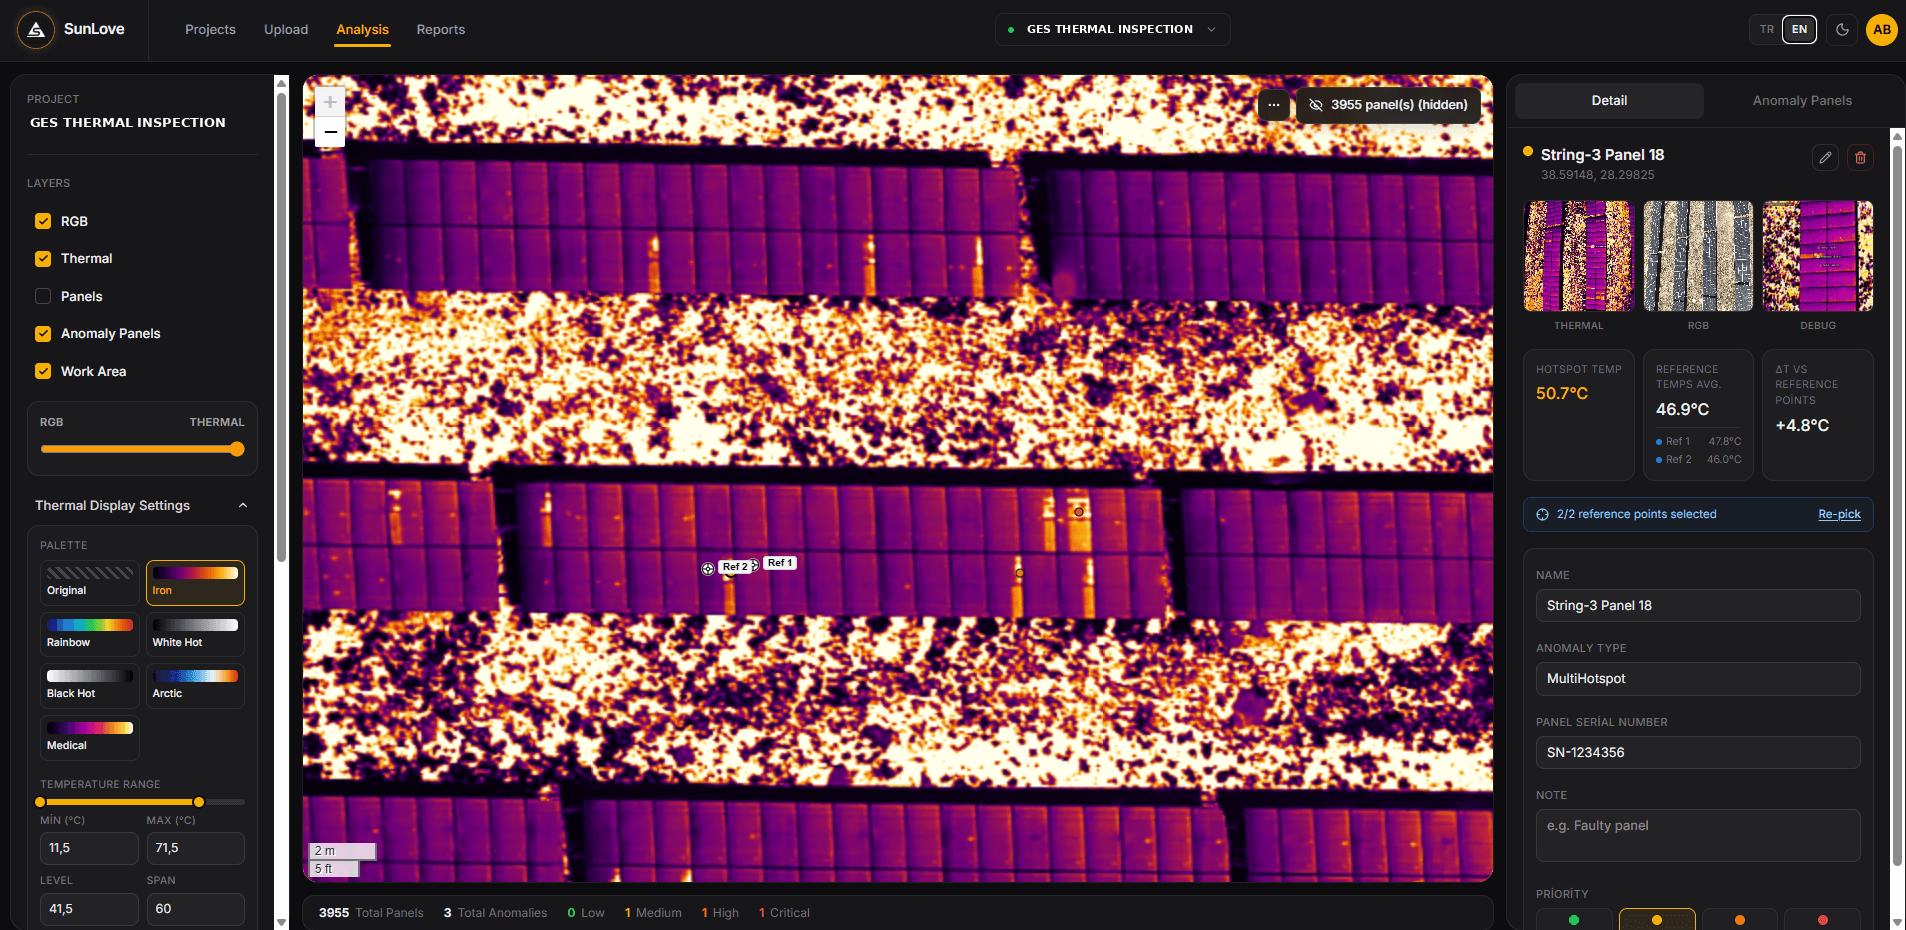
View the RGB and thermal orthophotos from your drone flight in the same workspace. Switch between layers instantly, or use the slider to compare both images with pixel-level precision.
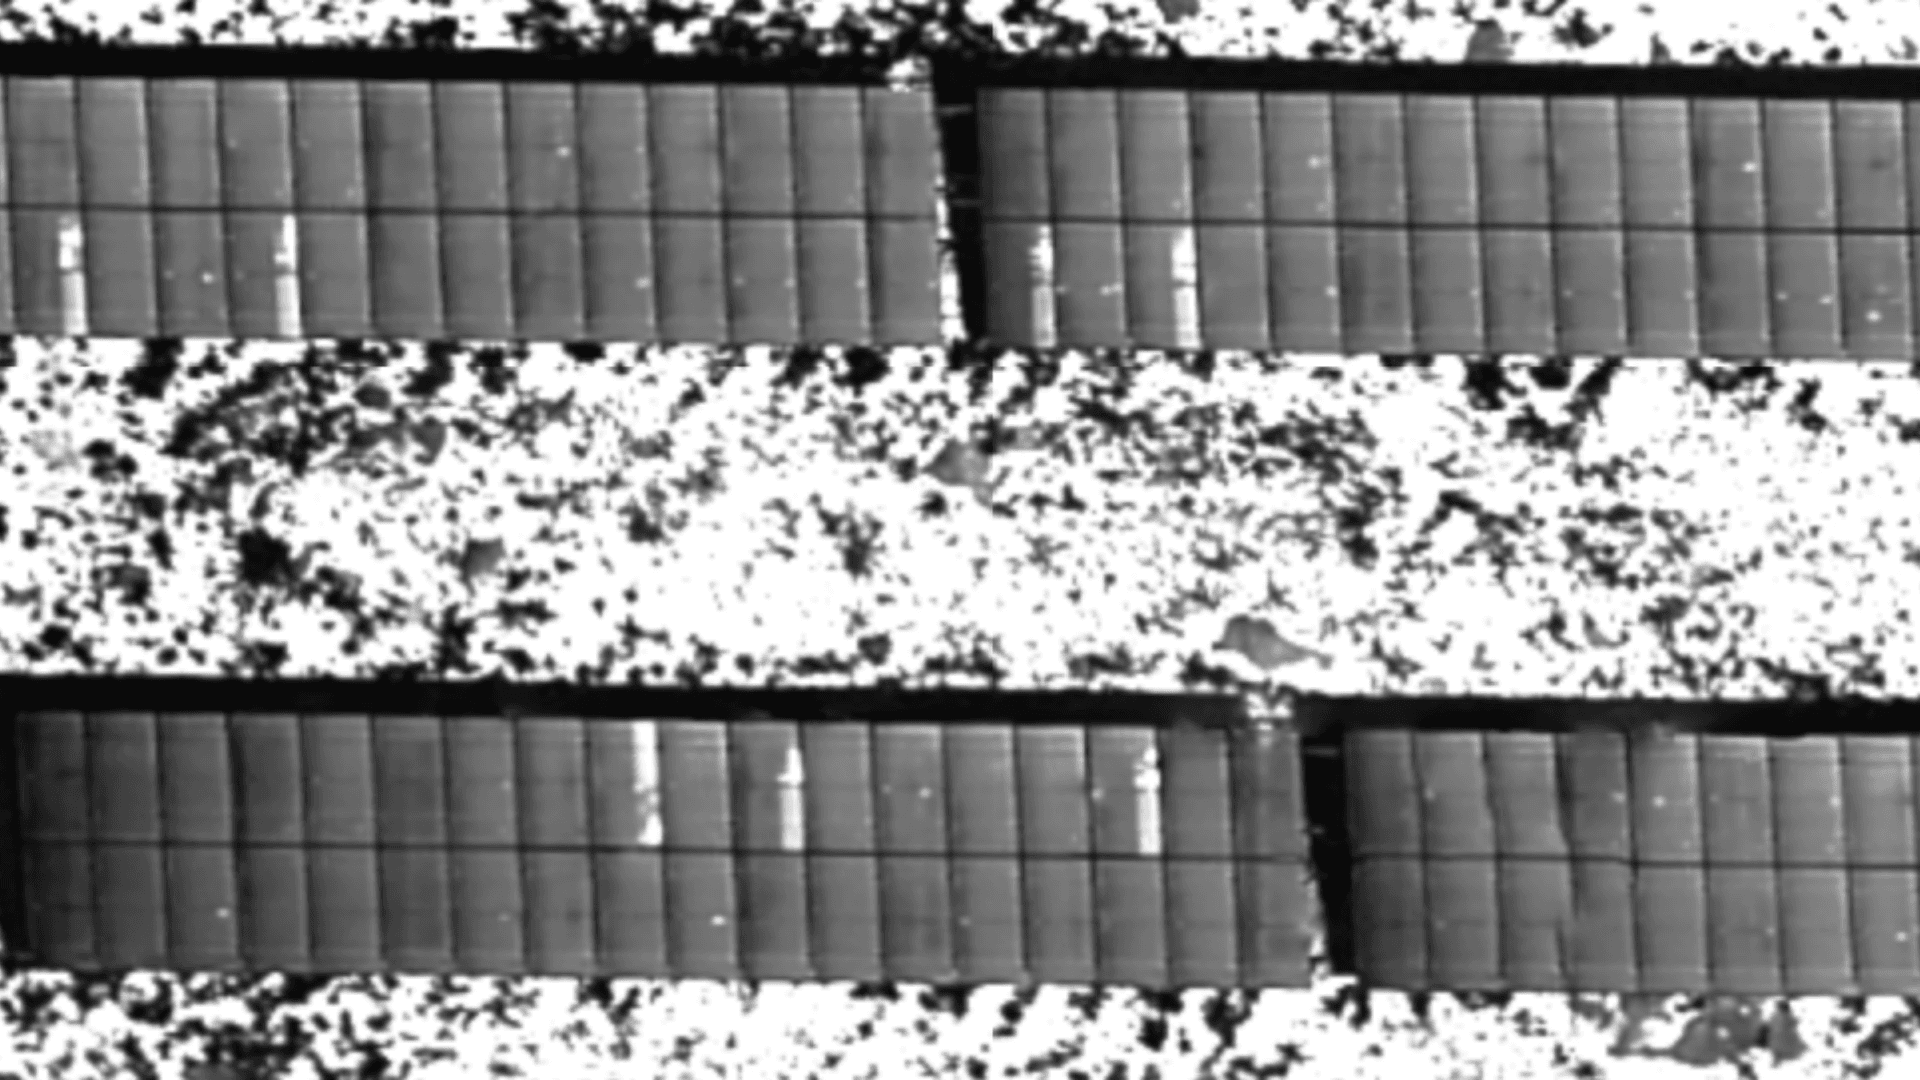
Customize Thermal Imagery
Adjust the temperature range and color palette to reveal different thermal details more clearly. Analyze with industry-standard palettes like Iron, Rainbow, White Hot, Black Hot, and Arctic, fine-tuning the range in seconds to surface even the smallest temperature differences.
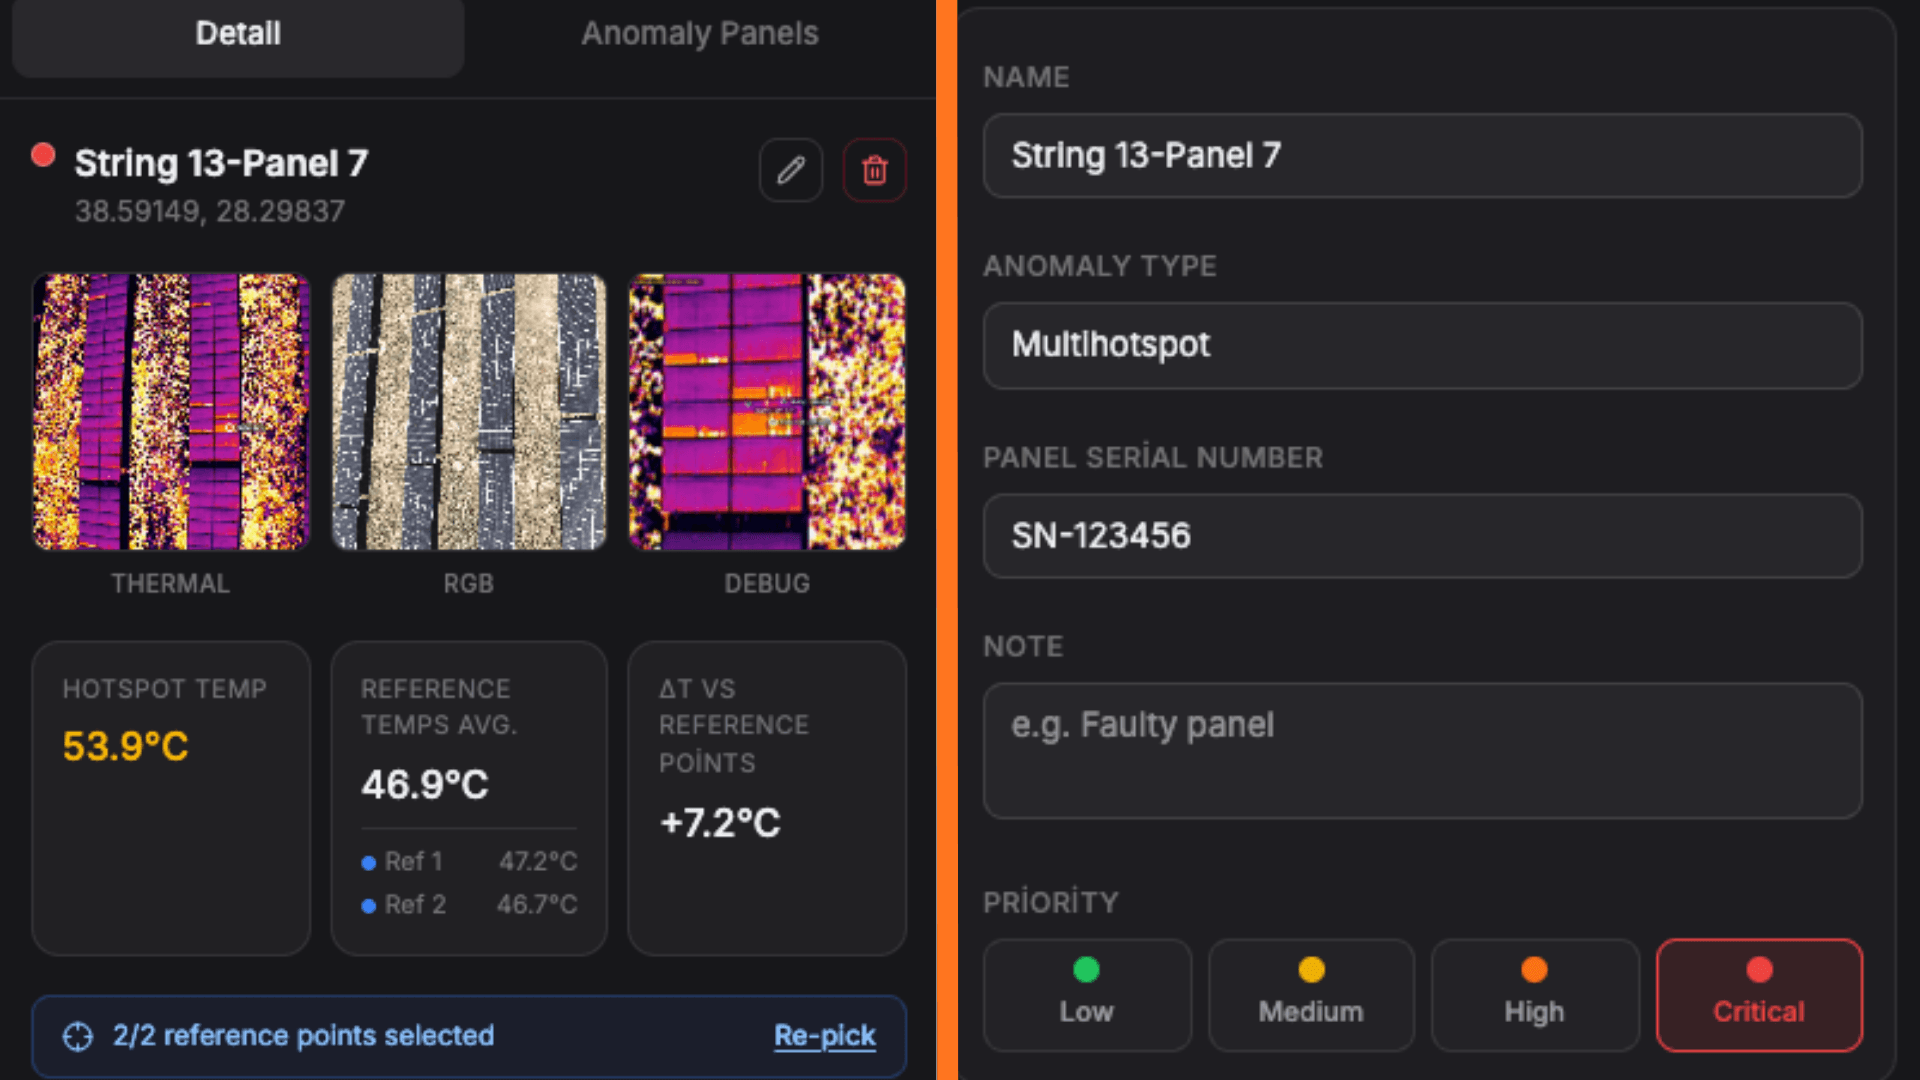
Precise Anomaly Analysis with ΔT
Review the hotspot temperature, reference temperatures, and ΔT value for every anomaly on one screen. Evaluate the RGB, thermal, and detail imagery together to make more accurate decisions.
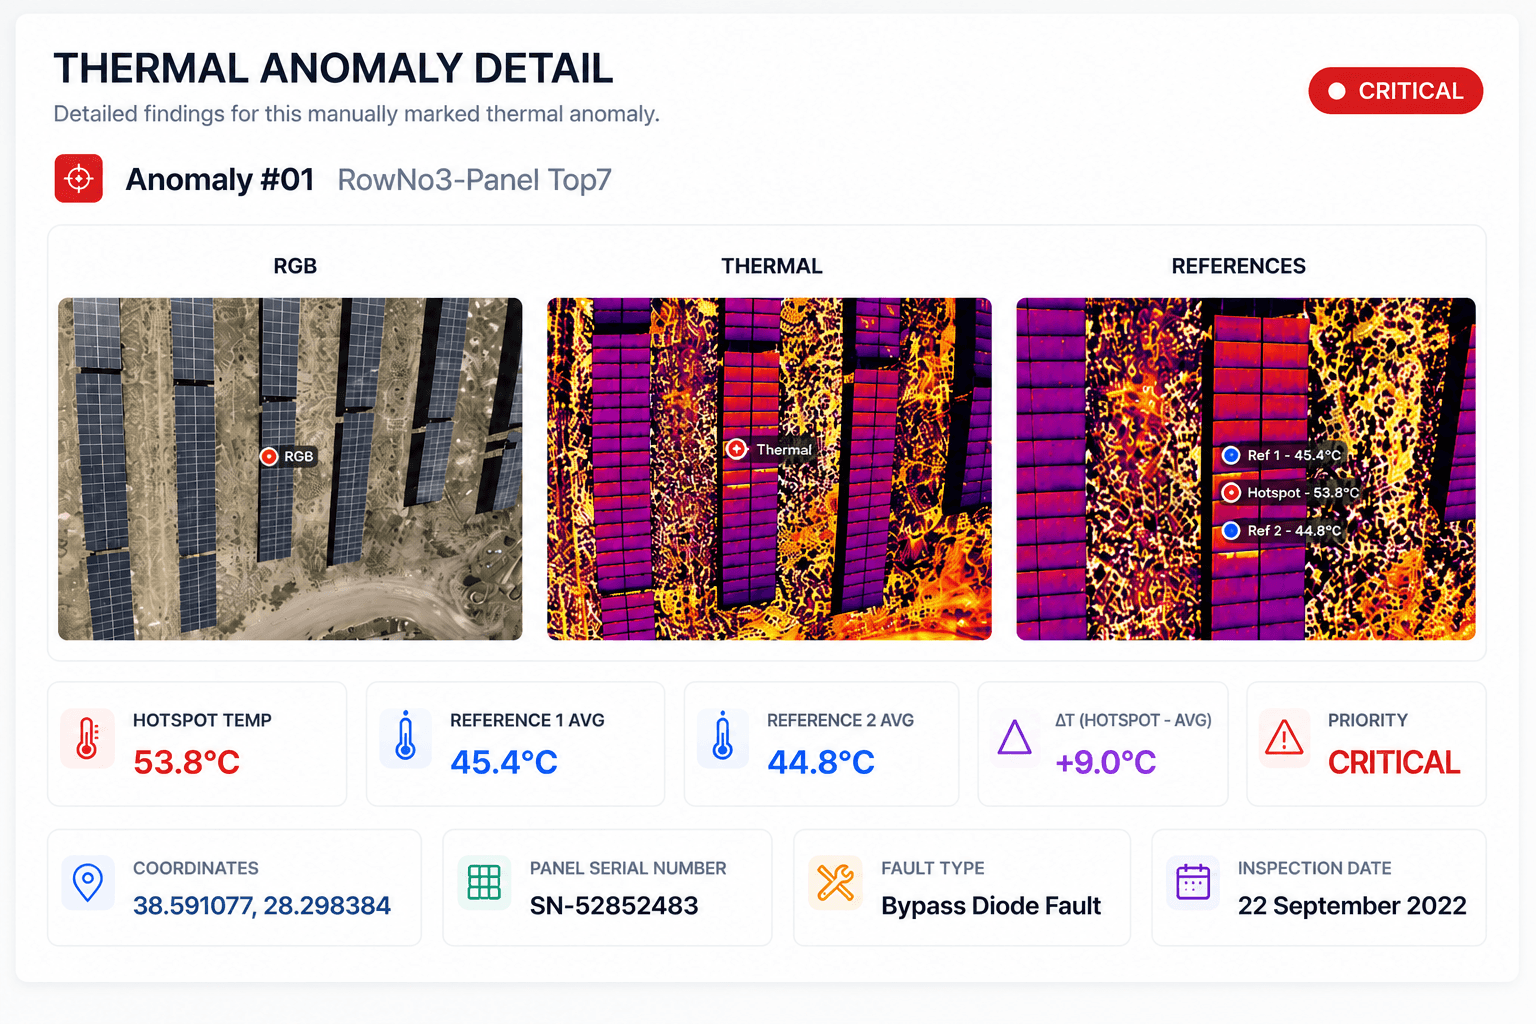
Generate Professional PDF Reports
Turn your inspection results into professional PDF reports with a single click. RGB and thermal imagery, ΔT analyses, panel information, priority levels, and coordinates are all presented neatly in one report. Generate output in both Turkish and English report options. Click the coordinate link to view the panel's exact location directly on the map.
Choose the Working Model That Fits You
Use the platform yourself, or leave the entire process to us. Choose whichever working model fits your needs.
Use the Platform Yourself
Upload your imagery, run your thermal analyses, and generate your reports in minutes.
Send Us the Imagery, We'll Handle the Analysis
Send us your drone imagery; we'll prepare the analysis, anomaly review, and report for you.
End-to-End Service On Site
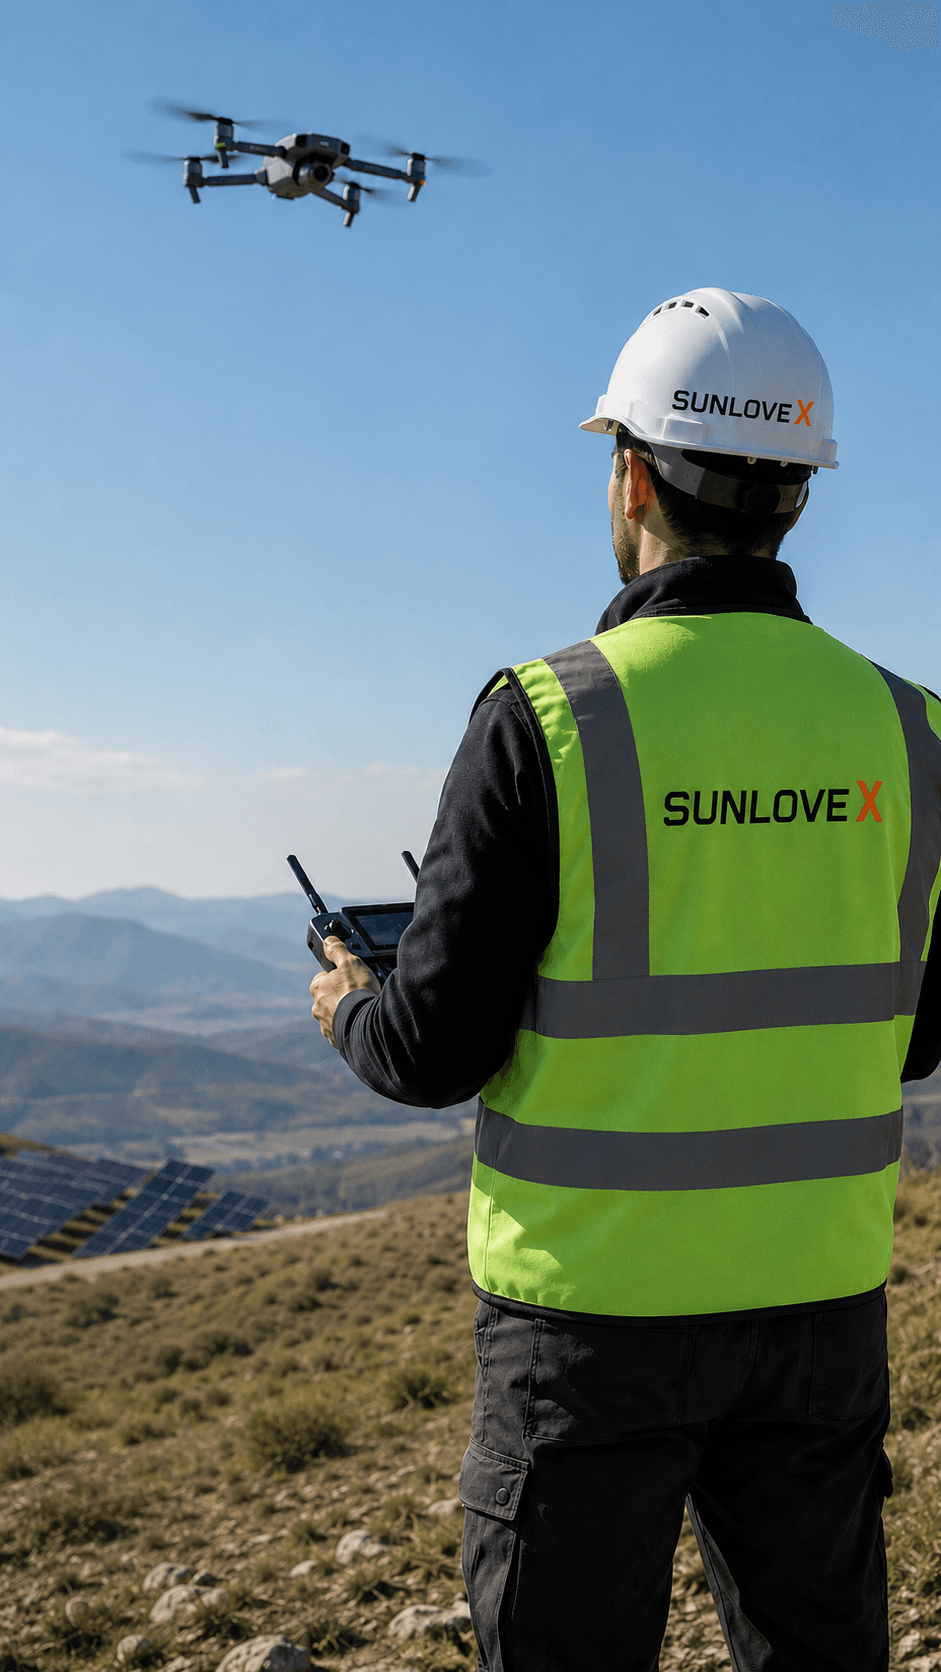
We'll come to your site; we handle the drone flight, thermal inspection, analysis, and reporting end to end.
From Field to Report in Three Steps
Upload
Upload your RGB and thermal drone imagery. Let SunLove X generate the orthophotos automatically.
Analyze
Analyze anomalies on the map, take ΔT measurements, and prioritize your findings.
Report
Generate your IEC-compliant, professional PDF report in one click and share it.
Inspect Every Panel in the Field — in Minutes
Upload your drone imagery and let SunLove handle the rest.
Built Down to the Details
Every tool you need in the field, in one platform.
RGB & Thermal Layers
Review visual and thermal data side by side, and slide between the two views.
Severity-Based Prioritization
Prioritize anomalies by Low, Medium, High, and Critical severity.
Reference Point Calibration
Pick two reference points to precisely calculate temperature deviation (ΔT).
Panel Serial Tracking
Match every anomaly to a panel serial number and GPS location for the record.
Customizable Thermal Palettes
Choose between Iron, Rainbow, White Hot, Black Hot, Arctic, and Medical palettes.
Multi-Language Support
Switch the platform between Turkish and English in a single click.